Technical Indicator
WHAT IS A MOVING AVERAGE?
Moving Average (Moving Average, MA) is a statistic conducted by the continuous average values over a specific period of time.
Moving average is one of the most common technical indicators. It provides an overall trend of price and forecasts upcoming trends and the possibility of turning trend. It is well accepted among traders given its simple application.
TYPES OF MOVING AVERAGE
For the length of period, it can be divided into three kinds:
Short-term: 5 days and 10 days
Medium-term: 20 days and 50 days
Long-term: 100 days, 200 days, or even 250 days
The shorter the period, the smaller the lag. In other words, it reflects recent changes in the trend faster. For example, a 10-day moving average is closer to the recent price than a 250-day moving average.
Conversely, the longer the period, the greater the lag. It is mainly used to showcase a long-term trend.
How do I apply A MOVING AVERAGE?
1. Determining price trends
Moving Average offers investors a macro reference for determining whether the market is bullish or bearish. Normally, analysts will see 200-day moving average as the bull-bear demarcation line.
If the price rises over the 200-day moving average, it is seen as a bullish signal. Conversely, if the price falls through the 200-day moving average, it is seen as a bearish signal.
If the price continues to stay above the 200-day moving average, an upward trend is formed and investors can look for possible buying opportunities.
Conversely, if the price remains below the 200-day moving average, a downward trend is formed and investors can seize the chance to sell.
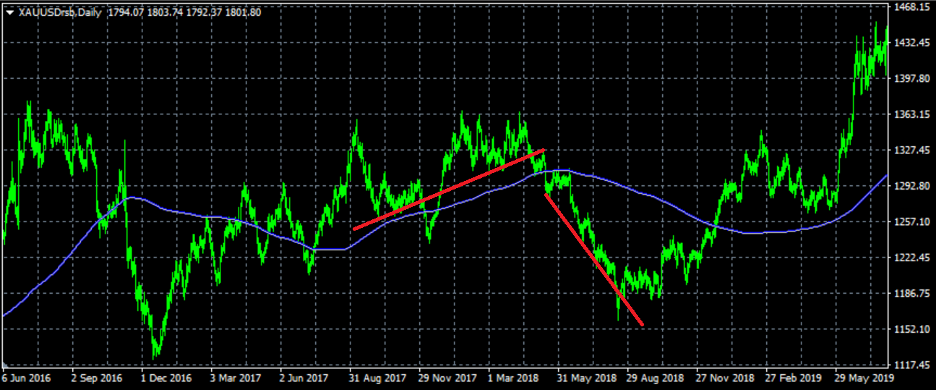
As shown in the Spot Gold Daily Price Chart above, gold prices is above the 200-day moving average at the beginning and creates an upward trend. When the gold price falls and hits the 200-day moving average, there is a possibility of a turning trend. Afterwards, the gold price drops below the 200-day moving average and begins a downward trend.
2. Gold Cross and Death Cross
After figuring out the main trend of the market, it’s time to look for the entry chance. By doing so, we should look at the two different averages and find the intersections as entry signals.
When the fast line (shorter period) rises over the slow line (longer period), that means the recent trend is breaking the long-term trend and creates a buy signa, which is the gold cross. Investors can confirm the turn of trend and enter.
When the fast line (shorter period) drops below the slow line (longer period), that means the recent trend is breaking the long-term trend and creates the sell signal, which is the death cross. Investors can confirm the turn of trend and sell.
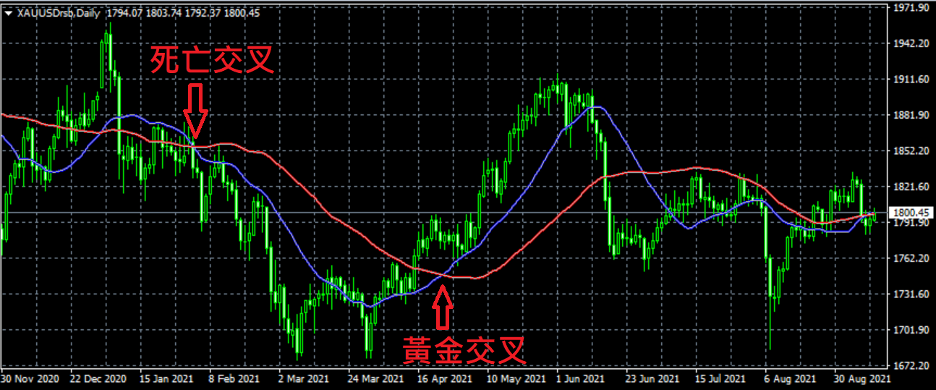
Example:
We add a 20-day moving average to the daily chart as the fast line and a 50-day average as the slow line.
When the 20-day moving average fast line rises above the 50-day moving average, the gold cross is formed. Investors can confirm the turn of trend and enter.
When the 20-day moving average fast Line falls below the 50-day moving average, the death cross is formed. Investors can confirm the turn of trend and sell.
THE DISADVANTAGE OF MOVING AVERAGES
Since the moving average needs to be calculated from the previous values, the results may be delayed. Besides, the longer the cycle, the greater the lag. The market price may already react before the average reaches the highest/lowest point or a gold/death cross is formed. This hinders investors to react in time. Moving averages only provide a macro reference for investors. If investors need a more comprehensive analysis, other indicators have to be included.
What is the RSI?
RSI, Relative Strength Index, is used to estimate the momentum of buyers and sellers, measure the magnitude of price changes and to determine whether the market is overbought or oversold.
The importance of RSI
If the buying momentum is strong, there is a greater opportunity of rise. On the contrary, if the selling momentum is strong, there is a greater opportunity of drop.
However, if we only rely on price changes to determine the market situation and ignore the process within, we may overlook the change in momentum.
For example, both 2 cases are also up 8% in 20 days. In different time, trends, orders and magnitudes can vary or even be completely different. (i.e. rise slowly, fall before rise, rise and then stabilize).
To apply RSI, apart from determining the up and down trend, you can also see the momentum of buyers and sellers. If the momentum is stronger, the RSI value will tend to be more extreme.
How to interpret and apply RSI indicators?
The value range of RSI is from 0 to 100. Commonly, 50 is the demarcation line.
Value greater than 50: the buying momentum is strong, the rising magnitude is stronger.
Value less than 50: the selling momentum is strong, the dropping magnitude is stronger.
If price rises in large magnitude, the RSI value will be above 50. The stronger the buying momentum, the greater the RSI value.
On the contrary, if price drops in large magnitude, the RSI value will be below 50. The stronger the selling momentum, the smaller the RSI value
If the market does not have a clear direction, the RSI value will stay around 50.
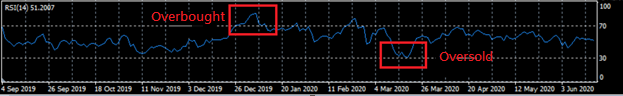
In addition, if the value goes to extreme, there will be overbought or oversold (Generally, >70 means overbought, < 30 means oversold), there is a chance to overturn.
Value > 70: When the price rises quickly, overbought appears. If buying momentum turns weak, there is an opportunity to turn downwards.
Value < 30: When the price drops quickly, oversold appears. If selling momentum turns weak, there is an opportunity to turn upwards.